The bankruptcy forecast coefficient is a quantitative way to assess the likelihood of financial insolvency. Its significance is important for business owners, investors, enterprise management, creditors, and employee partners. The basis for the calculation is the balance sheet data (F. No. 1). A decrease in the indicator indicates a deterioration in the company’s affairs and the risk of default.
Identifying unfavorable trends in the work of an organization and the first signs of default is an important task for investors, owners, management, creditors, government agencies, and sometimes even employees of the enterprise. A quantitative assessment of the probability of bankruptcy will allow for the timely withdrawal of assets from business and the adoption of management decisions to prevent the company’s insolvency.
The bankruptcy forecast ratio (CPB) is a relative financial indicator that characterizes the share of net working capital in the structure of the company’s balance sheet. It allows you to determine whether the organization is able to pay off its short-term obligations using funds received from the sale of inventory.
Reference! Until 2000, forecasting the bankruptcy of companies was carried out exclusively on the basis of multifactor models of foreign authors - Altman, Godtser, Konan. However, only specialist analysts with knowledge in the field of econometrics could calculate them. However, 15 years ago, a simple formula was derived for analyzing the probability of business default using financial reporting data.
KPB is a quantitative method for assessing the viability of an enterprise. With its help you can understand:
- whether the company's reserves are sufficient to cover its short-term obligations;
- whether the organization can quickly sell them and pay off its current debts.
If the capital structure ratio indirectly affects the possibility of financial insolvency, then the bankruptcy indicator accurately determines the likelihood of such a development of events.
Reference! If the calculated value of the bankruptcy forecast coefficient turns out to be sufficient, then the enterprise can be considered solvent, and the probability of bankruptcy in the next six months can be considered low.
Table 1. Factors of change in the bankruptcy forecast coefficient
| The coefficient is decreasing | The coefficient increases |
| 1. Current debts are paid off, but new obligations are not opened. |
| 2. The base of reserves and deferred tax payments is growing. |
| 3. Asset turnover increases. |
Reference! In recent years, banks have been actively using the assessment of the probability of bankruptcy: using publicly available financial statements, they regularly calculate the KPB.
Formula for calculating the bankruptcy forecast coefficient
The source of data for determining the probability of default of a business is the main element of the company’s financial statements: its balance sheet (F. No. 1):
- current assets (Article 1200);
- deferred tax liabilities (Article 1180);
- short-term liabilities (Article 1500);
- balance sheet currency (Article 1700).
Important point! When assessing the likelihood of financial solvency, it is important to compare the timing of liabilities with the timing of current assets and deferred tax payments. So, if the debt must be repaid within six months, then receivables with a maturity of up to 3 months will not be taken into account.
In economic analysis, the formula for calculating the enterprise bankruptcy forecast indicator looks like this:
Kpb = OA+ONO – KO /VB, where
- OA – current assets;
- ONO – deferred tax liabilities;
- KO – short-term liabilities;
- VB – balance sheet currency.
The above formula for practical application can be expressed in balance sheet items:
Kpb = art. 1200 + art. 1180 – art. 1500/st. 1700
Important point! In Russian practice, companies have deferred tax payments only for VAT, therefore, for companies exempt from it and those business entities whose activities are taxed at a rate of 0%, the second variable in the formula is omitted.
Bankruptcy forecasting
Bankruptcy is a widespread problem that individual entrepreneurs and legal entities face in the course of their activities. Many organizations go bankrupt every year in our country; Therefore, timely identification of adverse trends is of paramount importance.
What is bankruptcy?
Bankruptcy is the inability of an organization to pay its debt obligations and finance ongoing core activities due to a lack of cash. The main sign of bankruptcy is a delay in payment of debt for more than 3 months.
The probability of bankruptcy is one of the estimated characteristics of the current financial condition of the organization under study. The management of an enterprise can constantly maintain the probability at a low level if it periodically analyzes the probability of bankruptcy and takes the necessary measures in a timely manner.
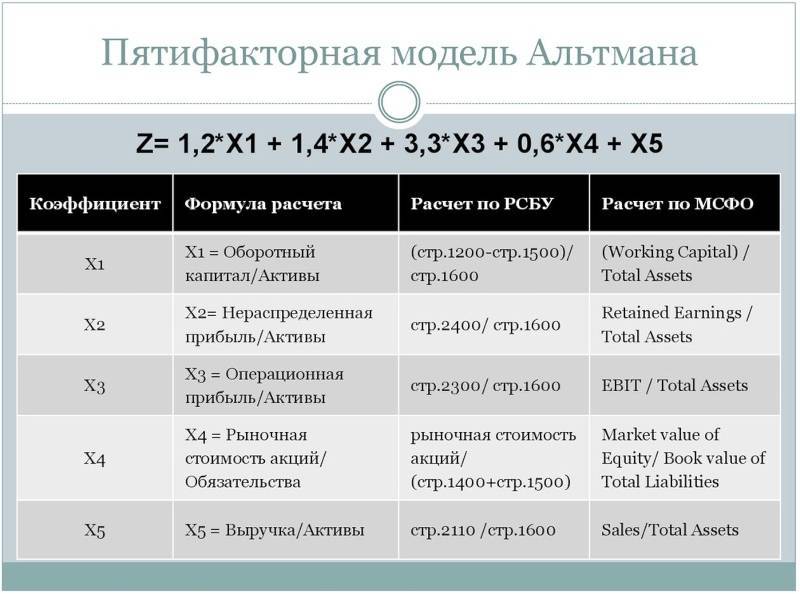
Altman Z-score
Currently, there are various methods for assessing the likelihood of bankruptcy of an enterprise. The most accurate in a market economy are multifactor bankruptcy forecasting models, which usually consist of five to seven financial indicators. In practice, the so-called Altman “Z-score” is most often used to assess the probability of bankruptcy. The final bankruptcy probability coefficient Z is a function of five indicators characterizing the economic potential of the enterprise and the results of its work over the past period: the structure of assets and liabilities, profitability and turnover. Each of the indicators was given a certain weight, established by statistical methods.
Z = 1.2 * K1 + 1.4 * K2 + 3.3 * K3 + 0.6 * K4 + K5, where
K1 - the share of current assets in the total assets of the organization. The indicator characterizes the degree of liquidity of the organization.
K2 - return on assets on retained earnings. The indicator characterizes the level of financial leverage of the organization.
K3 - return on assets based on profit before taxes. The indicator characterizes the efficiency of the organization's operating activities.
K4 - ratio of equity and borrowed capital.
K5 - asset turnover. The indicator characterizes the profitability of the enterprise's assets.
Depending on the value of the “Z-score”, the probability of bankruptcy within two years is assessed on a certain scale. When analyzing an organization, you should pay attention not so much to the scale of bankruptcy probabilities, but to the dynamics of this indicator.
Altman's Z-score allows you to determine not only the risk of bankruptcy, but also the level of creditworthiness, therefore it is used by banks to assess the borrower's creditworthiness, financial stability and likelihood of bankruptcy.
Standard indicator value
Since enterprises in different sectors of the economy have different volumes of liquid assets and deferred tax payments, there is no single standard value for the bankruptcy indicator. However, several criteria for its analysis can be identified:
- the coefficient value must always be positive (Kpb>0). The opposite situation indicates that the company's reserves are not enough to cover its short-term debts;
- if the indicator value increases, then its financial position improves and vice versa;
- if the default forecast indicator is more than 100%, then the company does not effectively use borrowing opportunities in its activities.
Important point! KPB is not analyzed as a point value for a single business: it is usually compared with a basic or industry average ratio, a similar indicator by a competitor, or year-on-year dynamics.
Concept of coefficient
This indicator is used to analyze the share of net working capital in the total assets of the entire balance sheet of a particular analyzed enterprise.
Definition 1
The bankruptcy ratio is an indicator that reflects the ability of an enterprise to pay short-term debts (liabilities) with the condition that all reserves will be successfully sold.
It is worth noting that in the economics of an enterprise there are a significant number of different models for predicting bankruptcy; there is no single approach, since each enterprise, due to its individual characteristics, has the right to independently choose a methodology for predicting bankruptcy.
In general, there are quantitative and qualitative methods.
Quantitative methods are based on the analysis of figures from financial statements and other documents of the company, and qualitative methods are based on the study of economic prerequisites, comparisons with successful and bankrupt enterprises).
Thus, the bankruptcy ratio refers to a quantitative method for assessing the welfare of a company.
Finished works on a similar topic
- Coursework Bankruptcy ratio 420 rub.
- Abstract Bankruptcy ratio 220 rub.
- Test work Bankruptcy coefficient 240 rub.
Receive completed work or specialist advice on your educational project Find out the cost
Methods and models for assessing the probability of bankruptcy
To diagnose the likelihood of bankruptcy, classical assessment methods are used as much as possible. They will help to effectively evaluate a company, classify it, find out whether the company has the ability to overcome the crisis, or whether it is a potential bankruptcy. Foreign methods for assessing the likelihood of bankruptcy are especially popular, among which are:
- Altman's technique. One of the highest quality methods that allows you to give optimal forecasts about the proximity to insolvency. For example, it is often used in large enterprises with an expensive stake and access to the securities market.
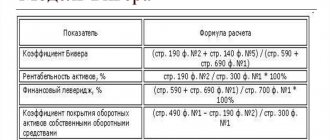
- Beaver's technique. This technique is not very suitable for use at Russian enterprises, since it does not take into account the specifics of enterprises in the Russian Federation.
- Taffler's technique. It is used quite effectively at Russian enterprises, but only large ones.
The methods under consideration have their strengths and weaknesses, so experts advise using several at the same time to get the most accurate results. But each of these methods has its own characteristics, so let’s look at them in more detail.
Altman model
One of the most frequently used foreign methods for analyzing the probability of bankruptcy of an enterprise is the Altman method. Works with z-score. This is a quantitative method based on specific financial data. parameters.
Altman developed a five-factor model, compiled into the formula:
Z = 0.717X1 + 0.847X2 + 3.107X3 + 0.42X4 + 0.995X5
If you look at it, each value in this formula is important:
- X1 – divide working capital by total assets of the company;
- X2 – financial leverage;
- X3 – divide total profit before tax by borrowed money;
- X4 – divide the total value of your capital and borrowed capital;
- X5 – divide total sales by the amount of the company’s assets.
Bankruptcy is determined by the “Z” value. The results are considered as follows:
- Z
- 1.81 ≤ Z
- 2,77
- 2.99 ≤ Z – minimum.
But the method also has disadvantages. For example, functional limitation. In particular, the method is suitable for companies with shares on the stock market. Therefore, the measure is considered more effective for foreign companies and does not work well in the Russian market. In addition, this technique was developed quite a long time ago, which also does not work in its favor. Although, this does not mean that the method is absolutely useless.
Taffler model
Another effective method that has been used to assess bankruptcy for years is the Taffler, or Taffler-Tishow, model, developed in 1977. This is a four-factor model for analyzing the possibility of bankruptcy. It was created after checking eight dozen companies, among which there were both bankrupt enterprises and companies that were solvent at the time of the analysis. As in the previous case, this procedure can be used to analyze enterprises with shares on the stock exchange.
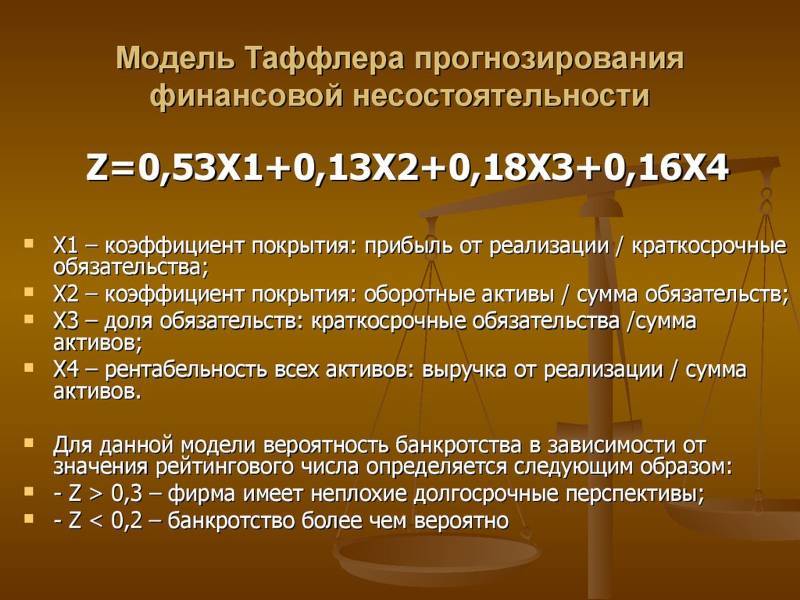
The formula looks like this:
Z = 0.53Х1 + 0.13Х2 + 0.18Х3 + 0.16Х4
Deciphering the meaning:
- X1 – shows the degree of fulfillment of obligations (calculated as the division of income before the payment of obligatory payments on borrowed money);
- X2 – working capital (the entire set of current assets is divided by their total volume);
- X3 – financial risks (dividing the total number of current liabilities by the total number of assets);
- X4 – the company’s ability to pay off debts (dividing total revenue by total assets).
Z is defined as follows:
- more than 0.3 – negligible probability;
- less than 0.2 – high probability.
This model is quite accurate due to the large number of companies it has been tested on. Although it also has disadvantages:
- works only for joint-stock organizations;
- use for ros. companies are in question due to the specific economy of the Russian Federation;
- outdated data.
Although the technique is old, it is not for nothing that it has been used for decades.
Beaver model
The Beaver model is another method for determining the possibility of bankruptcy, which is considered classic. To make a calculation on it, you need to take into account the following indicators:
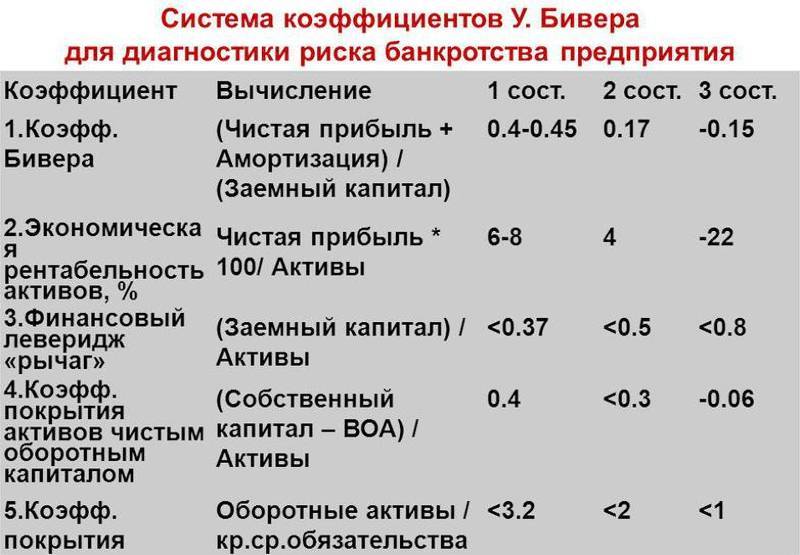
- what net turnover is used (calculated as an asset);
- income received by the company from assets;
- share of passive loan;
- real liquidity ratio;
- ratio of profit and loan obligations.
If the coefficient is more than 0.2 and lasts longer than one and a half/two years, the probability is high.
Belikov-Davydova model
This model for predicting enterprise bankruptcy was proposed by A. Yu. Belikov in his dissertation in 1998 and became one of the first in Russia. Since Belikov’s scientific supervisor was G.V. Davydova, this model of financial stability is sometimes called the Belikov-Davydova model. But names such as the Belikov model and the IGEA model are also used. In all cases, we are talking about the same model for assessing the financial stability of a business.
In the process of developing the model, a certain sample of trading companies was analyzed, some of which went bankrupt, and the rest remained financially stable.
The formula for assessing the financial stability of a company is as follows:
8.38 * K1 + 1 * K2 + 0.054 * K3 + 0.63 * K4.
The K1 coefficient is calculated using the formula: Working capital / Assets. In RAS, these indicators are contained on page 1200-page. 1500 / page 1600.
The K2 coefficient is determined by the formula: Net profit / Equity capital (line 2400 / line 1300 according to RAS).
To calculate the K3 ratio, you need to divide Revenue by Business Assets (according to RAS: line 2110 / line 1600).
The K4 coefficient is determined by dividing Net Profit by Cost (line 2400 / line 2120 according to RAS).
Part of Belikov's model is based on Western financial models. Thus, the coefficient K1 is calculated here by analogy with the Altman bankruptcy model, the coefficient K3 is used in the Taffler bankruptcy model.
Other financial ratios have not been used previously in foreign literature.
Additional specific weight (8.38) in this model belongs to the value of the K1 coefficient. It is this indicator that is considered the most important when analyzing financial stability.
The results of the bankruptcy analysis should be interpreted as follows:
- If the resulting value is less than 0, the company’s risk of going bankrupt is maximum (90-100%).
- If the value is from 0 to 0.18, then this indicates a high risk of bankruptcy (60-80%).
- If the value is in the range from 0.18 to 0.32, then the risks of going bankrupt are average (35-50%).
- At high coefficient values of more than 0.42, the risks are minimal (up to 10%).
The main disadvantage of this model is the possibility of its use exclusively for the analysis of trading enterprises. This analysis technique is suitable only after the emergence of a crisis situation when obvious signs of bankruptcy arise.