How is the loss of solvency ratio calculated?

The loss of solvency coefficient is calculated as a guide if the balance sheet structure is satisfactory. If it is less than one, then, theoretically, there is a threat of a liquidity shortage. In this case, it is necessary to study the financial and economic condition of the enterprise in more detail.
Solvency is the timely repayment of the enterprise’s debts to creditors, counterparties, and contractors within agreed terms. This is an important criterion for the stable operation of any company, the key to a stable financial position. Banks and investors pay close attention to the analysis of the economic condition of the enterprise and its solvency. This knowledge will allow them to soberly assess risks and protect themselves from losses.
One of the indicators of the financial analysis of an enterprise is the loss of solvency ratio (LOS). It is relative and is needed to forecast the deterioration of current liquidity over the next few months (usually 3, 6).
Reference! Current liquidity includes current assets (property that is used to conduct business and bring profit to the company).
If a company loses its solvency, this is expressed in:
- late utility and other payments;
- untimely repayment of accounts receivable;
- missing payments on loans and advances;
- presence of other debts.
All this negatively affects the business reputation of the enterprise, its credit history, and also entails real financial losses (fines, penalties, penalties). The company's lack of commitment also repels investors and characterizes it as unstable.
PMC is found using the formula:
- KTL NP – current liquidity ratio at the beginning of the period;
- KTL KP – current ratio at the end of the period;
- T – period (in months);
- 3 – number of months for which the coefficient is calculated;
- 2 – standard current ratio.
Thus, to find the estimated value of the indicator, you need to calculate several other economic indicators.
Note! If the current liquidity ratio and working capital ratio are higher than the standard value, then only in this case does it make sense to calculate the PIC. That is, the indicator is found with a satisfactory balance structure.
Formula
PMC is found using the formula:
- KTL NP – current liquidity ratio at the beginning of the period;
- KTL KP – current ratio at the end of the period;
- T – period (in months);
- 3 – number of months for which the coefficient is calculated;
- 2 – standard current ratio.
Thus, to find the estimated value of the indicator, you need to calculate several other economic indicators.
Note! If the current liquidity ratio and working capital ratio are higher than the standard value, then only in this case does it make sense to calculate the PIC. That is, the indicator is found with a satisfactory balance structure.
Loss of solvency ratio
Loss of solvency ratio
– this is a financial ratio showing the probability of deterioration in the current liquidity indicator of the enterprise over the next 3 months after the reporting date.
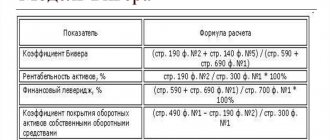
The coefficient of loss of solvency is approved in the Methodological Regulations for assessing the financial condition of enterprises and establishing an unsatisfactory balance sheet structure, approved by the order of the Federal Department of Insolvency (Bankruptcy) dated August 12, 1994 N 31-r). According to the document, the formula for calculating the coefficient is as follows:
Loss of solvency coefficient = (K1f + 3/T (K1f - K1n)) / K1norm
K1f - the actual value (at the end of the reporting period) of the current liquidity ratio (K1); K1n - current liquidity ratio at the beginning of the reporting period; K1norm - standard value of the current liquidity ratio; K1norm = 2; 3 - period of loss of solvency of the enterprise in months; T - reporting period in months.
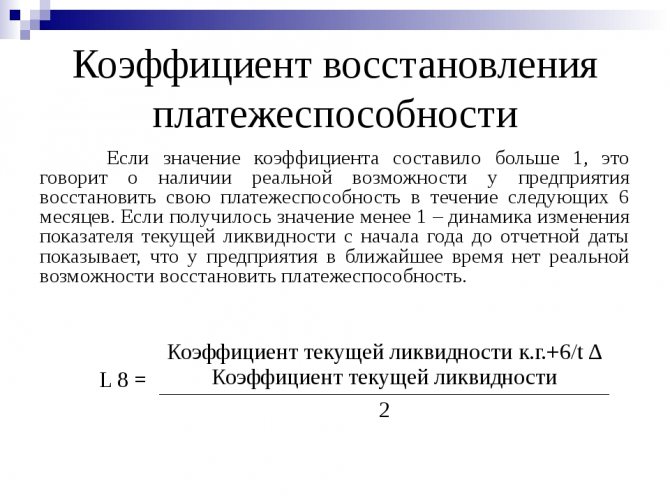
If the coefficient of loss of solvency is less than 1, this indicates that there is a real threat for the enterprise to lose solvency; this is a critical value. Those. given the dynamics of the current liquidity ratio that have developed since the beginning of the reporting year, after 3 months its value may drop below 2, becoming unsatisfactory.
The coefficient of loss of solvency, as well as the similar coefficient of restoration of solvency, cannot be considered a sufficiently reliable indicator. This is due to the fact that the calculation is based on the forecast of changes in the current liquidity indicator at only two points - at the beginning and end of the reporting period. A more reliable result is obtained by a linear trend based on data for 4 or more periods - this is precisely the technology for forecasting financial condition that is used in the “Your Financial Analyst” program.
Loss of solvency coefficient: formula, meaning, explanation
+ 3/T (Ktl.k. – Ktl.n.)) / 2, where:
- 2 is a standard indicator of today's liquidity ratio.
- T - reporting period, expressed in months;
- Ktl. k. - liquidity indicator as of today;
- Z - period of loss of solvency, expressed in months;
- Ktl.n. — the initial indicator that is relevant when the reporting period opens;
In some cases, it may be necessary, that is, about its absence.
What to do with the obtained indicators?
It can serve as proof of solvency. Law on restoring the debtor's solvency. Sometimes this procedure actually restores financial stability. Let's consider the values of the obtained coefficients:
- 1.81 - 2.7. Bankruptcy possibilities are average;
- 3. The enterprise is stable, has a positive balance sheet and is not in danger of bankruptcy.
- Less than 1.8. The risk of bankruptcy of the organization is quite high. additional possibilities for assessing bankruptcy risk;
- 2.8 - 2.9. The organization is financially stable;
If we use simpler calculation systems, then:
- an indicator less than one indicates a high risk of a crisis situation;
- indicators exceeding one indicate a relatively stable position of the organization.
The value is valid for three months.
What to do if calculations show a loss of ability to cover obligations?
For this time period, it is possible to build economic strategies focusing on the obtained values. It is also important to analyze the readings over time and compare the obtained numbers with the indicators calculated over the past three months.
The concept of the balance sheet solvency recovery ratio
Any enterprise that is engaged in entrepreneurial activity contains in its characteristics a solvency restoration coefficient, which manifests itself in the real possibility of restoring its own ability to make payments on these obligations for the corresponding period of time.
The time period for calculating this indicator is most often taken to be six months (6 months from the last reporting date).
In order to determine this indicator, the Methodological Provisions are used, in accordance with which the financial position of the enterprise is assessed. The methodological provision also establishes the limit value of the coefficient in order to determine the state of solvency of the enterprise.
The balance sheet solvency recovery ratio helps determine:
- the degree of loss of ability to pay bills and various types of debt;
- financial position of the enterprise;
- target orientation of entrepreneurial activity.
Loss of solvency ratio formula for balance sheet
Therefore, it is better to calculate the indicators for several years. It assumes the principle of instant payment, that is, how much money the company can give to creditors right now. The absolute liquidity ratio is calculated using the formula: (KFV + DS): KO, where KFV is short-term financial investments (line 250 of the Balance Sheet ); DS - cash (line 260 of the Balance Sheet); KO - the amount of short-term liabilities (line 690 of the Balance Sheet - line 650). Its optimal value ranges from 0.15 and above. The calculation includes money and securities.
It is believed that securities can be sold instantly, that is, it is the same money. At the beginning of the year - (620 + 550) := 0.1. At the end of the year - (590 + 700) := 0.09. This is not a very good result. All previous good figures were based on the fact that the company had many debtors.
In order to unambiguously recognize the impeccable liquidity and solvency of the company, it is necessary to further study the composition of the company's debtors in order to determine the possibility of quickly collecting debts. To calculate this important indicator, use the formula: (SK - VNO): OA, where SK is equity capital (line 490 of the Balance Sheet); VNO - non-current assets (line 190 of the Balance Sheet); OA - current assets (line 290 of the Balance Sheet). This indicator must be at least 0.1 (if lower, the company may be considered bankrupt). At the beginning of the year - (3,490) := 0 .53. At the end of the year - (4,995) := 0.49. These are good indicators. If the current liquidity ratio and equity ratio are below normal, this means that the company is on the verge of bankruptcy.
The final proof of this possibility is the solvency restoration coefficient. If this indicator is greater than one, then the enterprise has a real opportunity to restore its solvency. The formula for calculation is: KTL(k) + (6/T) x (KTL(k) - KTL(n)): 2, where KTL(k ) - actual value (at the end of the reporting period) of the current liquidity ratio; KTL(n) - value of the current liquidity ratio
Calculation of the coefficient of loss of solvency of an enterprise
– current liquidity ratio,
T – reporting period.
The number 6 in the formula means a period of six months (the period of loss of solvency).
In order to find the current liquidity ratio (Ctek.liq.), it is necessary to determine the ratio of the volume of current assets to the existing short-term debt:
To current liquid = OA / KO
Here OA is the value of current assets,
KO – short-term liabilities.
Total Solvency Ratio
Solvency is critical to running a business: the ability to pay debts on time and in full is one of the criteria for a viable enterprise. This is a completely accurate indicator that can and should be calculated regularly.
The solvency ratio is determined in two ways: using several indicators or based on balance sheet data. Both methods are good, but in practice, balance calculations are faster and more accurate. However, for a more complete picture, we will look at both options with examples.

Solvency ratio must be greater than or equal to 1
Normative value
Solvency is an indicator that is calculated based on specific numbers. From this thesis it is logical to assume that it has normal limits.
The standard value of the solvency ratio of an enterprise is on the border >= 1 (greater than or equal to 1).
Why is that? In the following sections, we will see that the calculation of this ratio is represented as the ratio of assets to debt. If they are equal, the result will be 1. If assets dominate debts, the result will be greater than 1. But when debts are greater than assets, the result will be less than 1, which automatically leads to the conclusion that there are solvency problems.
Formula by indicators
The first option for determining solvency is related to indicators of assets and debts. Formula for the current solvency ratio by indicators: enterprise assets / (short-term liabilities + long-term liabilities).
This formula is not suitable for accurate calculation. In practice, it is problematic to take into account the value of all assets without referring to accounting documentation. But the formula gives a general understanding of the composition of solvency and the interdependence of indicators.
Let's look at a simple example. The company owes two banks: the first - 1.2 million rubles, the second - 900 thousand rubles. In his warehouse there are finished products worth 1 million rubles, 400 thousand rubles in inventory, counterparties will pay another 1.5 million within a month, and all equipment can be sold at a price of 3 million rubles. How solvent is such a company?
What needs to be done: (cost of finished products + inventory + cost of equipment) / (debt to the first bank + debt to the second bank), that is, (1,000,000 + 400,000 + 1,500,000 + 3,000,000) / (1,200,000 + 900 000) = 1.9. The result obtained is greater than 1, which means the enterprise is fully solvent.
Balance formula
Calculation by indicators gives only a general idea of the state of the company. Its result can be conveniently used in presentations for investors or founders: to outline the current situation without overloading viewers with complex data. The work requires more objective calculations.
The balance sheet helps to more accurately calculate the overall solvency ratio. Balance formula: (line 1100 + line 1200) / (line 1400 + line 1500).

Solvency is defined as the ratio of existing assets to all liabilities
Calculation example
Let's look at how to calculate the solvency ratio based on balance sheet data. Let's assume the following values are recorded in the document:
- line 1100 - 1.5 million rubles;
- line 1200 - 870 thousand rubles;
- line 1400 - 768 thousand rubles;
- line 1500 - 97 thousand rubles.
We calculate: (1,500,000 + 870,000) / (768,000 + 97,000) = 2,370,000 / 865,000 = 2.73. The value is above 1, therefore it is within the limits of regulatory solvency, the company has no risk of bankruptcy.
Standard indicator
The methodological provision with the help of which the financial position of enterprises is assessed indicates the specific value of the indicator of the coefficient of solvency restoration on the balance sheet.
If the calculation results in a unit (with a calculation period of six months), then this indicates that the company cannot really restore its own solvency.
If the formula for the coefficient of restoration of solvency on the balance sheet results in a value of more than one, then we can talk about the real possibility of restoring solvency.
The formula for the coefficient of restoration of solvency on the balance sheet and its calculation makes it possible to determine the coefficient of restoration (loss) of solvency, including current liquidity, and also helps to predict the future activities of any company.
How to calculate the coefficient of loss and restoration of solvency
To perform the action, you must use a coefficient. If a person needs to find the coefficient of solvency restoration, the balance formula will help determine the value of the indicator.
Schemes for finding the indicator may vary.
If you need to determine the value of loss of solvency, the formula will look like this:
- K = (Actual liquidity + 3/: term in months * (Actual liquidity - Liquidity at the beginning of the term))/ 2
The resulting value reflects the probability of a deterioration in the financial position of the company. If the final value of the indicator is less than 1, the company is firmly located in the niche, and nothing threatens it.
This is a normal value for the indicator.
When the value exceeds 1, the owner of the organization should immediately take measures to normalize the situation of the organization. If no action is taken to improve the situation, the company risks going bankrupt.
To simplify the procedure for determining the value, you will need to study an example of calculating the coefficient of loss of solvency using the formula. The deterioration of the company's position may be temporary. After a certain period, the institution is able to restore its position and begin to make a profit.
The possibility of improving the situation can also be calculated. For this action the formula is used:
- K = (FL + recovery period in months/term in months * (FL – LDL))/2
If, after carrying out calculations, the result is a value whose size does not exceed 1, it will not be possible to improve the company’s condition in the near future.

An entrepreneur can try to normalize the situation or begin bankruptcy proceedings on his own. If the total value exceeds 1, the institution will be able to return to its previous level of solvency.
The owner of the organization must continue to carry out the actions that led to the normalization of the situation. If,
Examples of problem solving
The loss of solvency coefficient is calculated as a guide if the balance sheet structure is satisfactory. If it is less than one, then, theoretically, there is a threat of a liquidity shortage. In this case, it is necessary to study the financial and economic condition of the enterprise in more detail.
Solvency is the timely repayment of the enterprise’s debts to creditors, counterparties, and contractors within agreed terms. This is an important criterion for the stable operation of any company, the key to a stable financial position.
Calculation example
An example of PMC calculation is given in the table (download in excel).
I half of 2020
II half of 2020
Number of months for which the coefficient is calculated
Current ratio standard
Thus, for the first half of 2020, the PLC was below 1. This means that a loss of solvency was expected in the next 3 months. But this did not happen, and in the second half of the year the value of the indicator was already more than 1.
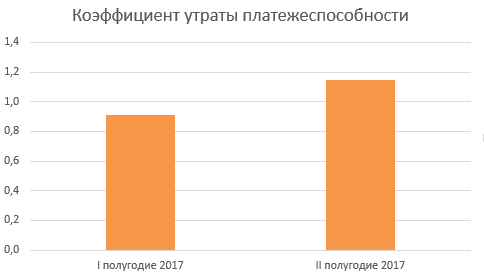
Rice. 1. PMC diagram
Forecasting
The coefficient of recovery/loss of solvency is considered one of the key ones in the management analysis of a company. These indicators allow you to plan financial and economic activities for a certain period. The solvency recovery coefficient makes it possible to distribute operations and funds over the next six months to get the company out of the crisis. However, this situation can be avoided. To do this, you should calculate the indicator of the probability of deterioration in the current liquidity of the company for the three months following the reporting date: Kup = [K1f + 3/T (K1f - K1n)] / K1norm.

The benchmark with which the coefficient of recovery/loss of solvency is compared is taken to be one. If, when calculating the probability of a deterioration in the financial situation, the indicator is greater than 1, then this indicates that the company has every chance of not losing its liquidity. Accordingly, with a value less than 1, the company may become insolvent in the next three months.
Normal value
The resulting value is compared with one: if it is less than 1, then the enterprise has serious problems with solvency, and there is a high risk of delinquency. If the PPC is greater than 1, it means the situation is stable and there is no likelihood of a deterioration in the financial condition.
Important! The value of the coefficient should be taken critically; it only indicates the likely occurrence of problems, but does not guarantee that they will definitely occur. Even if the value of the indicator is less than 0, the company can be considered solvent. Therefore, for a more accurate analysis of the situation, the indicator is found in parallel with the coefficient of overall solvency and the coefficient of severity of overdue obligations.
To increase liquidity to the standard value, you can use the following methods that help restore the situation:
- sale of own property at market price;
- cost reduction (discontinuation of unprofitable products, reduction of the branch network, personnel changes);
- suspension of investment in other projects;
- reduction of hospitality expenses;
- increase in the authorized capital and contributions of founders;
- attracting credit funds for a specified period;
- placement of bonds.
You can learn more about liquidity, its types, and ways to increase it from the video:
It is worth calculating the PLC for reference in order to have time to notice any changes in the liquidity provision of the enterprise. And although many experts criticize the indicator, it will in any case indicate a possible loss of solvency, and if such a threat exists, then it is worth delving into a more detailed analysis of the financial and economic condition of the company.
Analysis of the organization's solvency
The assessment of the organization's solvency is carried out on the basis of an analysis of the liquidity of current assets using solvency ratios, which are determined on the basis of the structure of the balance sheet of each specific enterprise and explanations to the balance sheet and are relative values. The calculated coefficients are then compared with their standard values. To measure solvency, three coefficients are calculated [2, p. 46]. These coefficients are presented in Table 1.
Table 1
Liquidity ratios of the organization
| Index | Calculation formula | Optimal value |
| Absolute liquidity ratio | (Cash + Short-term financial investments) / Short-term liabilities | 0,2 – 0,3 |
| Critical liquidity ratio (intermediate coverage ratio) | (Cash + Short-term financial investments + Short-term receivables) / Current liabilities | 0,8 – 1 |
| Current ratio (total coverage ratio) | Current assets / Current liabilities According to the updated calculation: (Current assets - Long-term receivables): Current liabilities | 1,5 – 2 |
Each of the three ratios represents the ratio of one or another group of current assets items to the same value - the sum of liability items expressing the short-term debt of the enterprise at a point in time (the beginning or end of the reporting period).
The indicators listed above are of interest not only to the management of the enterprise, but also to external subjects of analysis: the absolute liquidity ratio is of interest to suppliers of raw materials, the intermediate liquidity ratio is of interest to banks, and the current liquidity ratio is of interest to investors.
However, the listed coefficients when characterizing solvency have a number of disadvantages:
- static, that is, these indicators, calculated according to the balance sheet and its explanations, characterize the property position of the enterprise on a certain date and, therefore, are one-time, so they should be studied only in dynamics;
— the current liquidity ratio is overestimated due to the inclusion of “dead items” in current assets;
— accounts receivable may be overdue or unlikely to be collected, in this regard, the values of the intermediate and current liquidity ratios may be overestimated due to illiquid accounts receivable.
The main sign of the insolvency of an enterprise is its insolvency. To assess the structure of the balance sheet and diagnose bankruptcy, two coefficients are used [1, p. 48]:
— current ratio;
— the ratio of own working capital, which is calculated as the ratio of own working capital to the sum of all current assets (formula 1) and shows how much own funds cover current assets. Its standard value must be at least 0.1, that is, 10% of current assets must be covered by own assets.
(1)
where: SD – the sum of sources of equity capital – is the difference between the total of the third section of the balance sheet and the total of the first section of the balance sheet;
ObA - current assets taken into account when assessing the structure of the balance sheet - this is the result of the second section of the balance sheet of Form No. 1 minus accounts receivable, payments for which are expected more than 12 months after the reporting date.
The structure of the enterprise’s balance sheet is recognized as unsatisfactory, and the enterprise is considered insolvent if one of the following conditions is met [3, p.286]:
— the current liquidity ratio at the end of the reporting period is less than 2;
— the equity ratio at the end of the reporting period is less than 0.1.
There is, however, an opinion that the standard value of the current liquidity ratio is overestimated - for most enterprises this ratio is below 2, although there is no doubt about their solvency.
If at least one of the specified coefficients does not meet the requirements established above, the solvency restoration coefficient for the upcoming period (6 months) is calculated. If the coefficients satisfy the standard values, the coefficient of possible loss of solvency for the upcoming period (3 months) is calculated. Thus, the presence of a real opportunity for an enterprise to restore (or lose) its solvency during a certain, predetermined period is determined using the coefficient of restoration (loss) of solvency presented in formula 2 [3, p. 286].

, (2)
Where:
,
– current ratio at the beginning and end of the period, respectively;
6(3) – period of restoration (loss) of solvency, months; The period for restoration of solvency is taken to be 6 months, the period of loss is 3 months;
T – duration of the reporting period, months;
2 - standard value of the current liquidity ratio.
The solvency restoration coefficient, which takes values greater than 1, indicates that the enterprise has a real opportunity to restore its solvency. If this coefficient is less than 1, then the enterprise has no real opportunity to restore solvency within six months. The coefficient of loss of solvency, which takes a value greater than 1, indicates that the enterprise has a real opportunity not to lose solvency within three months. If this coefficient is less than 1, then the enterprise may soon lose its solvency.
According to the Federal Law “On Insolvency (Bankruptcy)”, a legal entity is considered unable to satisfy the claims of creditors for monetary obligations and (or) fulfill the obligation to make mandatory payments if the corresponding obligations and (or) obligations are not fulfilled by it within three months from the date when they had to be fulfilled.
Let us analyze the solvency of the previously discussed balance sheet of the Alpha organization. The given indicators are calculated at the beginning and end of the analyzed period, their dynamics are assessed, and the factors that caused a change in the level of current liquidity are identified (Table 2).
table 2
Analysis of the solvency of the Alpha organization
| Index | Optimal value | For the beginning of the year | At the end of the year | Deviation (+,-), (gr.2 – gr.1) |
| 1. Cash and short-term financial investments, thousand rubles. | X | 7702 | 6434 | -1268 |
| 2. Short-term accounts receivable, thousand rubles. | X | 44525 | 96202 | +51677 |
| 3. Total value of current assets, thousand rubles. | X | 134235 | 251785 | +117550 |
| 4. Short-term liabilities, thousand rubles. | X | 105669 | 98526 | -7143 |
| 5. Absolute liquidity ratio (item 1/item 2) | 0,2 – 0,3 | 0,073 | 0,065 | -0,008 |
| 6. Critical liquidity ratio ((item 1+item 2)/item 4) | 0,8 – 1 | 0,494 | 1,042 | +0,548 |
| 7. Current ratio (clause 3/clause 4) | 1,5 – 2 | 1,270 | 2,556 | +1,286 |
From the calculations presented in this table, it follows that at the beginning of the year, the Alpha organization, using available funds (there are no short-term financial investments), was able to repay only 7.3% of its short-term obligations, and at the end of the year - even less ( 6.5%). At the same time, if the organization receives money from debtors, then at the end of the year it will be able to pay off all its debts (the critical liquidity ratio at the end of the year was 1.042). At the same time, in the event of the sale of inventories, the organization has a significant reserve of funds on the same date to pay off short-term obligations (current liquidity ratio - 2.556). Thus, it should be noted that the Alpha organization has a lack of absolutely liquid assets. By the end of the year, accounts receivable increase, which contributes to an increase in the critical liquidity ratio. However, the main source of covering short-term liabilities is inventories. Their significant growth led to a significant increase in the current ratio from 1.270 to 2.556. In general, the current solvency of the Alpha organization increased by the end of the year.
You should also consider the structure of the balance sheet and diagnose the bankruptcy of the organization. To do this, it is necessary to compare the current liquidity ratio and the equity ratio at the end of the reporting period with standard values. As can be seen from Table 2, the current liquidity ratio (2.556) is greater than the standard value (2). The coefficient of provision with own working capital (0.18) is also greater than the standard value (0.10) (calculations are presented in formula 3.3), which indicates a satisfactory balance sheet structure.
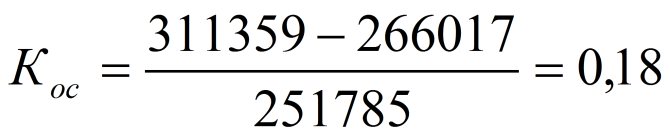
.
Therefore, to check the stability of the financial situation, it is worth calculating the coefficient of loss of solvency for a period of three months.
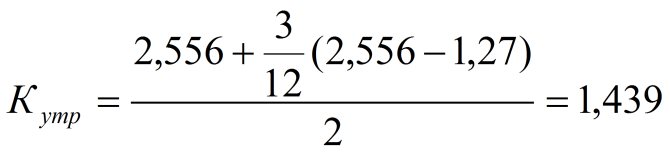
.
Analysis of the data obtained showed that although the organization has a violation of the liquidity of the balance sheet and the analysis of the absolute liquidity ratio indicates the unstable financial position of this enterprise, the analysis of the organization's solvency suggests that it is able to cover all its obligations (short-term and long-term) with all available assets, and Also, the loss of solvency of the enterprise is not expected within three months. Based on the analysis of the efficiency of use of the enterprise’s property, we can conclude that during the period under study, the enterprise experienced generally positive changes in the use of property.
Literature:
- Artemenko V.G. Analysis of financial statements: textbook / V.G. Artemenko, V.V. Ostapova. – 5th ed., erased. – M.: Omega-L Publishing House, 2010.
- Lyubushin N.P. Comprehensive economic analysis of economic activity: textbook. – 2nd ed., revised. and additional – M.: UNITY-DANA, 2007.
- Reshetnikova A.I., Rozhentsova I.A. Financial stability and solvency of the company / Reshetnikova A.I., Rozhentsova I.A. // Audit statements. – 2010. – No. 3.
Calculation formula (according to reporting)
First calculate the current ratio and then substitute it into the formula:
(Ktl.kon. + 3 / T * (Ktl.kon. - Ktl.start)) / Ktl.norm.,
Ktl.kon. — the value of the current liquidity ratio at the end of the reporting period; Ktl.beg. — current ratio at the beginning of the reporting period; Ktl.norm. — standard value of the current liquidity ratio; K1norm = 2; Number 3 - period for calculating the risk of loss of solvency of the enterprise, in months; T - reporting period in months, usually the number 12.
Calculation formula
KVP indicators are determined by entering the KTL and period values into the formula.
The formula itself looks like this: KVP = KTLk + 6/6 (KTLk – KTLn) /2, where:
- KTLk – KTL value at the end of the reporting quarter;
- 6/ (numerator) – period (in months) of restoration of solvency;
- /6 (denominator) – reporting period (in months);
- KTLn – KTL value at the beginning of the period;
- /2 – normal KTL value.
Note:
Usually, in calculations, the optimal period for restoring solvency is considered to be 6 months, but at the discretion of the entrepreneur himself, he can change it.
A normal KTL value (2) indicates that everything is fine with liquidity. Therefore, it is customary to consider two in the formula, but in some industries the coefficient of 1.5 was adopted as the standard value of KTL.
The KTL formula is quite simple: KTL = OA/KO, where:
- OA – current assets of the enterprise;
- KO – short-term liabilities of the enterprise.
A result below 2 (sometimes 1.5) indicates the company’s difficulties in paying off its debts.
Example
To make it clear, we first give an example of calculating KTL. Let’s take one company, let’s say with the name “N”. So, in April, the value of current assets was $5,500, and the amount of debts (accounts payable, borrowed funds, etc.) was $2,200.
By calculation:
- KTL = OA/KO = 5500/2200 = 2.5
For the period of April, the KTL was 2.5 (let’s say at the beginning of the first quarter the coefficient was 2.4), and in August the KTL was 2.3 (a very good result, but if compared with the indicators in April, the KO increased). In October, the KTL dropped to 2.1, and in January of the following year it was equal to 1.7.
Conclusion: CTL is gradually decreasing. The reasons may be different, especially such as:
- decrease in demand for the company's products for any reason;
- changing the work system;
- poor management;
- increase in current debt obligations, etc.
Based on this, we calculate the KVP in the first quarter: KVP = KTLk + 3/3(KTLk – KTLn) = 2.5 + 3/3(2.5-2.4)/2 = 1.3 KVP =1.3 Where:
- KTLk – KTL value at the end of the reporting quarter (2.5)
- 3/ (numerator) – period of restoration of solvency;
- /3 (denominator) – reporting period;
- KTLn – KTL value at the beginning of the period (2.4)
In the second quarter, the KVP will be 1.05, in the third quarter - 0.95, and in the fourth quarter - 0.65.
If in the next quarter everything does not change in a positive direction, then enterprise “N” will soon face a complete loss of solvency and then bankruptcy.
Conclusions about what a change in indicator means
If the indicator is higher than normal
There is no risk of loss of solvency in the next 3 months.
If the indicator is below normal
A risk of loss of solvency has been detected. Given the dynamics of the current liquidity ratio that have developed since the beginning of the reporting period, after 3 months its value may drop below 2, becoming unsatisfactory.
If the indicator increases
If the indicator decreases
Notes
The indicator in the article is considered from the point of view not of accounting, but of financial management. Therefore, sometimes it can be defined differently. It depends on the author's approach.
In most cases, universities accept any definition option, since deviations according to different approaches and formulas are usually within a maximum of a few percent.
The indicator is considered in the main free online financial analysis service and some other services
If you need conclusions after calculating the indicators, please look at this article: conclusions from financial analysis
If you see any inaccuracy or typo, please also indicate this in the comment. I try to write as simply as possible, but if something is still not clear, questions and clarifications can be written in the comments to any article on the site.
Loss of solvency ratio. Calculation formula
Books for your professional growth
58 tax optimization solutions
How to reduce VAT, save on income tax and contributions and optimize personal income tax
Everything to control company debts
A set of recommendations that will help improve the efficiency of loan portfolio management.
The most popular articles of the month: editor's choice
Factor analysis of key financial indicators
See how to find out why revenue, cost, EBITDA for the half year differ from the planned values
How to conduct a SWOT analysis of a company
Use step-by-step instructions for conducting a SWOT analysis