Types of short-term debt

For the functioning of an enterprise and its development in the right direction, it is important to know the degree of liquidity of a legal entity. Liquidity refers to the company's ability to quickly sell existing assets at prices close to market prices. To this end, it is important to understand the structure of the company's obligations.
As stated above, short-term debt is an obligation that must be repaid within 12 calendar months from the date the parties enter into the transaction.
There are various types of short-term debt, including:
- loan;
- debt on dividends to the owner of shares;
- unfulfilled obligation to pay staff salaries;
- bill of exchange;
- debt to the creditor for services or goods provided;
- etc.
For whatever reason, debt arises, the short-term debt ratio on the balance sheet is used to analyze the company’s financial position, its liquidity and potential risks. In this case, the specialist responsible for the calculations must study the enterprise’s reporting.
Individual cases
In addition to the debt ratio, there are other indicators of the current state of production.
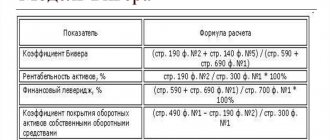
The receivables turnover indicator is calculated using the formula:
where KODZ is the receivables turnover ratio, VRT is revenue from the sale of goods, and DZ is loans receivable.
The debt turnover ratio to creditors shows the speed of settlements with lenders. It can be calculated by dividing the cost of production by existing accounts payable.
The current debt indicator is a coefficient demonstrating the percentage of short-term loans in the total structure of assets. It can be calculated using the formula:
where KZ are short-term loans, and VB is the balance sheet currency. An acceptable indicator is from 0.1 to 0.2.
There are three indicators of the composition of an organization’s obligations in relation to certain groups of counterparties specified in the Order of the Federal Service on Financial Recovery and Bankruptcy No. 16.
Indicator of debt on loans and credits from banks (K5)
It can be calculated by dividing the totality of long-term (line 590) and short-term loans of the company by the amount of average monthly income. Current liabilities are the amount of bank loans and other debts due within a year. They are indicated in the balance sheet line 610.
A company's average monthly income can be calculated by dividing the total income (for the balance sheet period) by the number of months in that period.
Debt indicator (K6)
This is the ratio of the amount of the company's accounts payable to other organizations to the amount of average monthly income. The amount of creditor loans includes the sum of the components indicated in lines 621 (debt to the supplier for delivered products or services), 622 (the totality of finances issued to lenders as a guarantee), 623 (debts associated with branches of the enterprise), 627 (received in account for future deliveries of products advances), as well as 628 (other liabilities).
Public system debt indicator
This coefficient is calculated by dividing the total debts to various government agencies by the average monthly income. Moreover, the first value represents the sum of all unpaid budget contributions (line 626 in the balance sheet), as well as debts to state funds (line 625).
The debt ratio is an important indicator of an enterprise's financial turnover and helps maintain a balance between the enterprise's own and attracted capital. With its help, the organization will be able to avoid problems with financing without significant losses.
The concept of short-term accounts receivable ratio
This ratio reflects the share of short-term debts in the structure of the enterprise's total liabilities and allows us to assess its financial position. With its help, a specialist can identify the emergence of negative trends that could worsen the economic condition of the company.
The calculation of the current short-term debt ratio is used:
- investors to check potential dividends and possible profitability of future transactions;
- by company managers when determining the effectiveness of management policies;
- financial analysts when identifying the risk of a company being declared insolvent;
- lenders to check the solvency of counterparties and identify risks when providing loans.
As mentioned above, this ratio is calculated on the basis of the enterprise’s balance sheet and reports provided by accountants. Specialists make the necessary calculations for each reporting period in order to see the company’s development trend, its competitiveness, market position and liquidity.
What is the debt ratio?
The debt ratio is an indicator that allows you to track the entire volume of loan receipts. It is used by financial analysts to identify problems in an organization's activities. This indicator allows business entities to maintain an optimal ratio of attracted and equity capital.
Debt ratio is an indicator that determines the ratio of the company's total assets to its total debt.
Why is it used?
The debt ratio is often used:
Dear readers! Our articles talk about typical ways to resolve legal issues with debts, but each case is unique.
If you want to find out how to solve your particular problem, please use the online consultant form on the right or call . It's fast and free!
- Organizations engaged in foreign economic activity. With its help, the ratio of all loans received from outside to the volume of gross domestic product is determined.
- The debt ratio is used by investors who are studying a proposed project. The data obtained will allow them to determine its potential profitability and possible dividends.
- This indicator is used by the management of a legal entity to determine how effective all management decisions were in the reporting period.
- The debt ratio is used by lenders before making decisions regarding the advisability of issuing loans. In this way, they assess the extent of possible risks.
How to calculate short-term debt ratio?

The coefficient value is calculated using a special formula. It reflects the share of short-term debts in relation to the company's total capital, which allows us to determine its stability in the market.
Below is the formula for the short-term debt ratio.
(SKO/OSA)
In this algorithm, MSE is the totality of short-term liabilities, and OCA is the total amount of assets.
The last indicator is calculated by the formula: (CD + DO), where CD are short-term debts, and DO are long-term liabilities.
Formula for Calculating Debt Ratio
Debt ratio (DR) is one of the calculated indicators used in analyzing the financial condition of a company. It reflects the share of assets formed as a result of attracting debt financing and is calculated using the formula:
(KZ + DZ) - the total amount of debt of the company;
A is total assets.
The formula for calculating the shortfall, presented through the balance lines, is as follows:
KZ = (page 1400 + page 1500) / page 1600.
For details of balance sheet lines, see the article “Deciphering balance sheet lines (1230, etc.).”
The following range of short circuit values is considered normal:
If the KZ is close to zero, this indicates that the company has extremely insignificant debt obligations in comparison with its equity capital. This is one of the indicators of financial stability.
When the coefficient approaches 1, it indicates that almost all of the equity capital is formed from borrowed funds. In most cases, this KZ value indicates a high degree of dependence on counterparties and creditors, which can negatively affect the financial stability of the company in the event of unfavorable developments.
Regular calculation of the CP allows you to timely track negative trends in the financial situation of the enterprise and take measures to eliminate them.
How is the financial stability of a company analyzed? learn from the material “Analyzing financial stability ratios” .
Application of the formula
How to interpret the resulting value? The lower the value of the indicator, the less short-term debts on the company’s balance sheet, therefore, the more long-term liabilities.
At the same time, the standard value of the coefficient can only be determined by a specialist (for example, a financial analyst), because it largely depends on the specifics of the company’s activities.
Does the company have a short production process? In this case, the coefficient indicators should be in the range of 0.5–0.7. The best option for companies with a long production process is from 0.1 to 0.5.
How else to interpret the coefficient readings? The higher the indicator, the more the company depends on short-term obligations requiring urgent repayment, which negatively affects the financial and economic stability of the legal entity.
The interpretation of the indicators can be as follows:
- 0.1–0.2 – the company’s position in the market is quite stable (this means that the company does not depend on its creditors and can use finance from working capital);
- 1:1 – the economic and financial condition of the company is considered risky.
Experts should regularly compare coefficient readings over different periods of time. This allows us to identify the emergence of negative trends for the development of the company.
If a problem with financial stability is detected, management may decide to use available capital to cover “hazardous” debts (that is, obligations that require repayment first). This avoids the risk of bankruptcy of the company.
I. Liquidity ratios
1. Absolute liquidity ratio
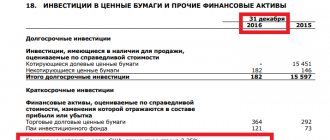
Shows what proportion of current debt obligations (accounts payable, short-term bank loans and other obligations) can be immediately repaid using cash and cash equivalents.
KAL = (Cash + Short-term financial investments) / Current liabilities
Recommended values: 0.2 - 0.5
2. Quick liquidity ratio (critical assessment)
The ratio of the most liquid part of current assets (cash, accounts receivable, short-term financial investments) to short-term liabilities.
KSL = (Cash + Short-term financial investments + Short-term receivables) / Current liabilities
Recommended values: 0.7 - 1
3. Current ratio
Shows what proportion of current debt obligations can be repaid in a short time using liquid current assets
KTL = Current assets / Current liabilities
Recommended values: 2 - 3
- 1. Own working capital
Shows the extent to which current assets are formed from equity capital.
SOS = Own capital – Non-current assets
- 2. Provision ratio of own working capital
K oss = SOS / Working capital
The minimum recommended value is 0.2.
6. Net working capital
Shows the excess of current assets over short-term liabilities. Reflects the ability of the enterprise to continue current production activities after paying off its short-term obligations.
NWO = Current assets - Current liabilities = Own capital + Long-term liabilities - Non-current assets
Recommended values: at least half of the total amount of current assets.
II. Capital structure indicators (financial stability ratios)
7. Autonomy (financial independence)
This ratio shows to what extent the assets of the enterprise are formed from its own capital, and to what extent the enterprise is independent of external sources of financing.
KA = Own capital / Balance sheet currency
Minimum recommended value 0.5 – 0.6
8. The financing ratio (the ratio of borrowed and equity funds) characterizes the volume of borrowed funds per unit of equity capital.
CF = Debt capital / Equity capital
Maximum recommended value 1
9. The current debt ratio characterizes the share of short-term borrowed capital in the total capital.
KTL = Current liabilities / Balance sheet currency
Recommended value 0.1 – 0.2
10. Financial stability coefficient (long-term financial independence)
shows the extent to which the enterprise's assets are formed from its own and long-term borrowed funds.
KFU = Equity capital + Long-term debt capital / Balance sheet currency
Recommended value 0.8 – 0.9
III. Profitability ratios
11. Sales profitability ratio, %
Demonstrates the share of net profit in the company's sales volume. It is calculated for all products as a whole and for individual assortment types.
ROS = Net profit from sales / Revenue from sales * 100%
12. Return on current assets ratio, %
Demonstrates the company’s capabilities in ensuring a sufficient amount of profit in relation to the company’s working capital used. The higher the value of this ratio, the more efficiently working capital is used.
RCA = Net profit * 100% / Average current assets
13. Return on assets ratio, %
Along with the ROE indicator, it is the main one used in market economies to characterize the effectiveness of investments in a particular type of activity.
ROA = Profit* 100% / Average asset value
14. Return on equity ratio, %
Allows you to determine the efficiency of use of capital invested by the owners of the enterprise. This indicator is usually compared with possible alternative investments in other assets.
ROE = Net profit* 100% / Equity
15. Return on investment ratio
Shows how many monetary units the company needed to obtain one monetary unit of profit. This indicator is one of the most important indicators of competitiveness.
ROI = Net profit* 100% / (Equity + Long-term liabilities)
IV. Turnover ratios (business activity)
16. Fixed asset turnover ratio (capital productivity)
This coefficient characterizes the efficiency of the enterprise's use of available fixed assets.
KOS = Sales revenue / Average cost of fixed assets
17. Asset turnover ratio (transformation ratio, resource efficiency)
Characterizes the efficiency of the company's use of all available resources, regardless of the sources of their attraction.
KOA = Sales revenue / Average asset value
18. Inventory turnover ratio
Reflects the speed of inventory sales.
KOZ = Cost of goods sold / Average inventory
19. Accounts receivable turnover ratio
The higher the turnover ratio and the shorter the collection period, the less funds are frozen in accounts receivable, the more mobile the company's current assets.
KODZ = Sales revenue / Average accounts receivable
Receivables collection period: TIDZ = 365 / KODZ
20. Accounts payable turnover ratio
KOKZ = Cost of goods sold / Average accounts payable
V. Market activity coefficients
21. Earnings per share
One of the most important indicators affecting the market value of a company. Shows the share of net profit (in monetary units) per ordinary share.
EPS = (Net profit – Dividends on preferred shares) / Number of common shares
22. Dividends per share
Shows the amount of dividends distributed on each common share.
DPS = Dividends paid on common shares) / Number of common shares
23. Share price to earnings ratio
This ratio shows how many monetary units shareholders are willing to pay for one monetary unit of the company's net profit. It also shows how quickly an investment in a company's shares can pay off.
P / E = Share Market Price/ EPS
24. Economic growth sustainability coefficient
This ratio shows the rate at which equity capital increases due to financial and economic activities, and not through attracting additional share capital.
sgr = (Net profit – Total amount of dividends paid) / Equity
Applying the coefficient
The short-term debt ratio is one of the most important indicators for analyzing the state of the enterprise, assessing the possibility of financial risks and stability. It shows how stable the enterprise is and helps to track negative trends. Its formula is based on indicators from the company’s reporting, as well as balance sheet information. Used by the following employees:
- The manager of the enterprise in order to determine how effective the management strategy is;
- Lenders to assess the solvency of the organization, analyze the degree of risks when providing loans;
- Investors will need the formula to estimate expected profitability and potential dividends.
In the course of doing business, each company assumes various obligations. A clear understanding allows you to choose the right tools to manage it. How is the inventory of accounts receivable carried out? This is a necessary step for proper debt management.
The formula allows you to compare various indicators in the industry in which the company operates. This is necessary in order to check its competitiveness and liquidity. The coefficient shows values that are easy to correlate with each other. You can use it to compare:
- Enterprises in a particular industry;
- Areas of activity;
- Dynamic indicators, that is, an increase or decrease in the organization’s liquidity for different reporting periods;
- Enterprise performance with industry average ratios.
The value of the ratio is important for the entire management of the company, as well as for creditors. It is recommended to find it for each reporting period in order to see dynamic indicators and track any new trends.
Inventory supply ratio
If you need to determine the inventory supply ratio, then you need to divide the personal sources that are used to purchase inventories by the cost of all these inventories.
KСОZ = (9236 – 7200)/6.203 = 0.3282
At the same time, the optimal situation is when reserves are formed using own reserves and using long-term liabilities, since if short-term debts are used for this, then this situation negatively affects the condition of the entire enterprise.
Thus, it is possible to highlight certain features of determining the financial condition of any company. The most important indicator for this is the short-term debt ratio, which should be as low as possible. The fact is that such debts lead to the fact that most of the profit that the enterprise receives in the process of operation must be aimed at paying off debts, and at the same time it is necessary to constantly expand its detail, improve goods or services, and also spend money on other goals. Also, a large number of short-term loans indicates that the company does not have the opportunity to take out a large long-term loan, and it also does not have its own funds that could be used to solve the problems for which short-term loans are issued.
If this ratio exceeds a certain value, then you can expect that when applying for a new loan, banking institutions will not be able to approve it. The fact is that each bank tries to issue loans exclusively to solvent organizations, therefore, before issuing money, it conducts a comprehensive assessment of them. If it is discovered that the company is not stable due to a large number of short-term loans, then it may find itself in a difficult situation when it will be impossible to attract borrowed funds in a crisis situation.
Car loans
Legislation
Business ideas
- Contents Urgent production of seals and stamps Who will act as buyers Where to open a business Equipment for running a business There are many types of businesses that can be started by people with entrepreneurial skills. Moreover, each option has its own unique features and parameters. Urgent production of seals and stamps The business idea of manufacturing seals and stamps is considered quite attractive in terms of...
- Contents Business idea for making postcards How to open a business based on creating custom postcards Employees Premises How to sell created postcards Many people with certain entrepreneurial abilities think about opening their own business, and at the same time evaluate and consider a large number of different options for opening. The business idea of making postcards is considered quite interesting, since postcards are such items in demand..
- Contents Choosing premises for a gym What do you need to open a gym? The gym is becoming increasingly popular in the modern world, as more and more people are thinking about leading a healthy lifestyle that includes proper nutrition and exercise. Therefore, any businessman can open a gym, but to get good income you need to think about it...
- Contents Store location Assortment of goods Sellers Jewelry is a must-have item in the wardrobe of every woman who takes care of herself and tries to look attractive and bright. Therefore, almost every entrepreneur who is aware of the possibility of making good profits wants to open his own jewelry store. To do this, you need to study all available prospects, draw up a business plan and predict possible income in order to decide whether...
Debt ratio
– one of the key financial multipliers used to analyze the state of a business entity, monitor negative trends and eliminate them in a timely manner.
Functions and Applications
Calculated based on balance sheet information and financial statements. Used:
- company management to identify the effectiveness of management decisions;
- creditors - to assess the degree of risks;
- investors - to form hypotheses about potential profitability and possible dividends.
The debt ratio allows you to compare:
- companies;
- economic sectors;
- different periods of operation of one enterprise;
- the results of the business entity’s activities with the industry average.